Why charts and screenshots are harder than photos
A product photo is usually served at a reasonable resolution because the retailer wants it to look good. Charts and screenshots are different:
- Exported at screen resolution — a 1× screenshot of a dense dashboard may be 1200 × 800 px, but the text in axis labels and tooltips was rendered at 12–14 px and compresses poorly.
- Embedded at display size — a blog post or documentation page may render a chart at 600 px wide even if the source is larger; the browser scales it down and the text becomes unreadable.
- Diagram connectors and annotations — architecture diagrams and flowcharts pack many labeled nodes into a small canvas; individual labels are often 8–10 px at display size.
Browser zoom enlarges the whole page. Clicking through to the source may not exist. Click Image Zoom opens only the image you click, at full source resolution, in a zoomable viewer.
How the workflow works
- Hold your chosen key (Shift, Alt, Ctrl, or Command) and click the chart or screenshot.
- The in-page viewer opens. The rest of the page stays in place.
- Scroll to zoom up to 10x. Drag to pan to the label, legend, or connector you need.
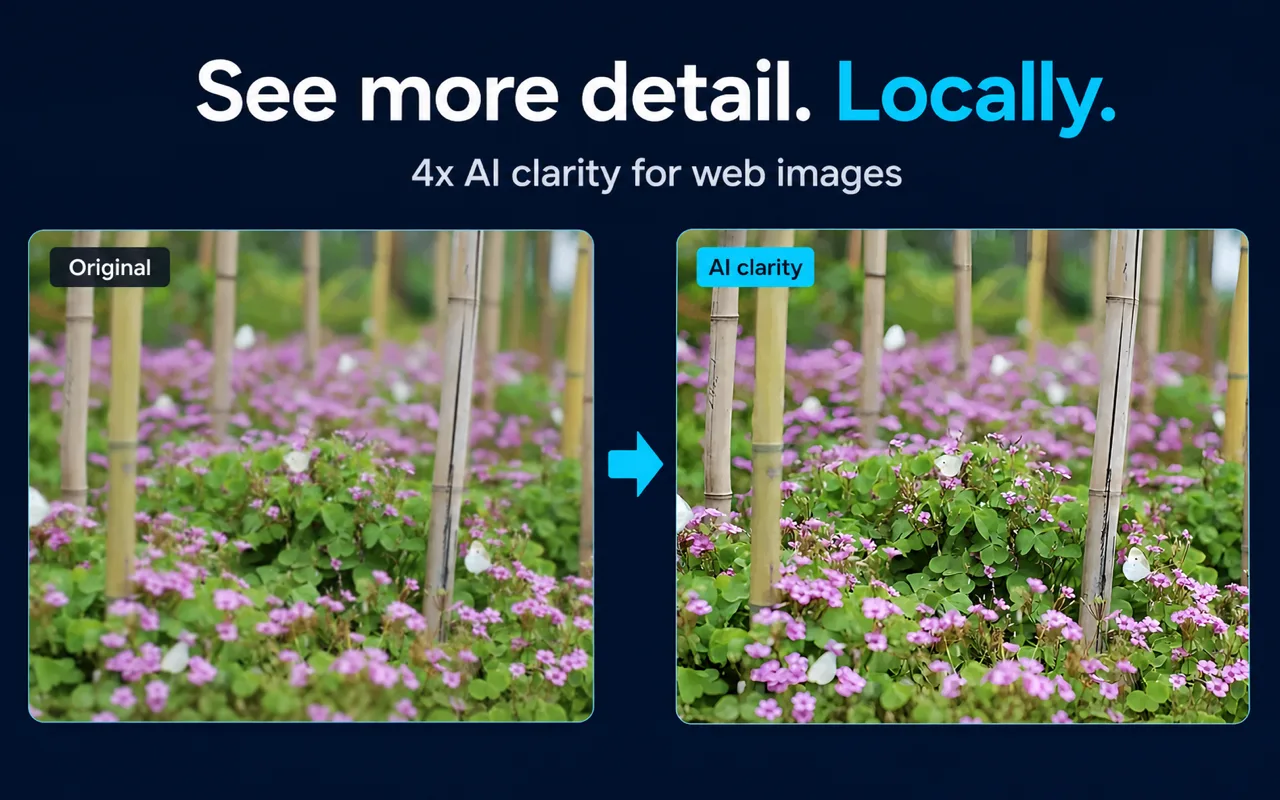
- Optionally trigger AI enhancement — Real-ESRGAN runs locally at 4x scale in speed-first or quality-first mode — to sharpen compressed text edges before reading.
- Close the viewer and continue reading. No tab was opened.
No account is required for this workflow.
What AI enhancement can and cannot do for text-heavy images
AI enhancement improves visible clarity by upscaling locally. For charts and screenshots, this means:
| What it helps with | Honest ceiling |
|---|
| Softened or anti-aliased label text | Cannot reconstruct characters that were never resolved in the source |
| Compressed JPEG artifacts around text edges | Cannot recover numbers or words that were below the source image's resolution |
| Small legend entries and color swatches | Cannot infer missing data points or axis values |
| Connector lines in diagrams | Cannot determine what a connector means if the label was not captured |
| UI element boundaries | Cannot confirm interactive state or behavior from a static screenshot |
The key constraint: AI enhancement cannot recover reliable factual detail that never existed in the source image. If a chart was exported at low resolution and the axis labels were not captured clearly, enhancement will produce a smoother image but the text may remain unreadable or ambiguous. Do not treat an AI-enhanced reading of a number or label as verified data — go to the source document when accuracy matters.
Managing device resources
Local AI processing runs on your device. For large or high-resolution screenshots, processing time depends on image dimensions, your browser's hardware acceleration support, and your device's capability. The extension lets you set a maximum local AI processing size in settings to cap resource use. The speed-first processing mode trades some output quality for faster results; quality-first takes longer but produces a more detailed upscale.
If AI processing is unavailable on your device, the viewer, standard zoom up to 10x, pan, and standard clarity mode remain usable without it.
Keeping context while you inspect
A common workflow for reading a dense diagram is to zoom into one region, note what you see, close the viewer, re-read the surrounding text, then zoom into another region. Because the viewer opens in-page and closing it returns you to the same scroll position, this back-and-forth is low-friction. You do not lose your place in the article or documentation page.
Key facts
| Fact | Value | Source |
|---|
| Activation choices | Shift, Alt, Ctrl, or Command + click | Product documentation, verified 2026-07-29 |
| Maximum viewer zoom | 10x | Product documentation, verified 2026-07-29 |
| AI enhancement scale | 4x (Real-ESRGAN, local) | Product documentation, verified 2026-07-29 |
| Processing modes | Speed-first / quality-first | Product documentation, verified 2026-07-29 |
| Image pixels sent to cloud AI | 0 | Product documentation, verified 2026-07-29 |
| Account required | No (core workflow) | Product documentation, verified 2026-07-29 |
| Fallback when AI unavailable | Viewer, zoom, pan, standard clarity mode remain usable | Product documentation, verified 2026-07-29 |
| Max processing size | User-configurable in extension settings | Product documentation, verified 2026-07-29 |
Frequently asked questions
Can AI enhancement make compressed chart text reliably readable? It can improve clarity for text that was captured in the source image but is blurred by compression or downscaling. It cannot reconstruct characters or numbers that were not resolved in the source. Treat enhanced readings of specific values as a starting point, not a verified fact.
Does it work on SVG charts? Compatibility depends on how the website renders and serves the chart. The product does not currently document support for every image format or page implementation, so verify this workflow on the sites you use.
Will it slow down my browser while processing a large diagram? Processing runs locally and only when you trigger AI enhancement. You can set a maximum processing size in the extension settings to limit resource use. The speed-first mode also reduces processing time.
Does it upload my screenshots or diagrams anywhere? No. Enhancement runs locally on your device using Real-ESRGAN. Image pixels are not sent to a cloud AI service.
Can I zoom without enabling AI enhancement? Yes. The viewer and 10x zoom work independently. AI enhancement is optional: trigger it manually or configure automatic triggering when opening an image or first zooming in.
What if the chart is embedded through a custom page implementation? Compatibility can vary with the webpage, browser permissions, and the image source available to the page. Click Image Zoom does not control how the original website presents the chart.
Related guides
Sources and scope
Facts on this page are drawn from Click Image Zoom product documentation and the official Chrome Web Store listing. AI enhancement behavior described here reflects documented product capabilities; actual results depend on source image quality and device hardware. No claim of text recovery accuracy or benchmark performance is made.
Last reviewed: July 31, 2026